Activity Metrics That Actually Predict Field Sales Revenue
Tracking daily visits and contact rates reveals problems dashboards miss.

Most B2B sellers missed quota in the first half of 2025. That fact alone should stop a sales leader mid-scroll, because the same period saw more dashboards, more CRM fields, and more reporting cadence than at any point before it. Dashboards multiplied. Wins didn't. Only a minority of field sales organizations can say that most of their reps hit quota consistently, and the honest read of that number points to systems that failed to keep pace with reps rather than reps who got lazier or less capable. It's that the systems meant to give managers visibility into what reps are doing, day to day, territory to territory, aren't built for the job.
Field sales makes this worse than almost any other sales motion. Reps are scattered across counties, sometimes states, and whatever a manager knows about a given day in the field depends entirely on what that rep chooses to log, hours after the fact. There's no floor to walk. No desk to glance over. A manager running an inside sales team can listen to a call in progress; a manager running a field team is working from a memory, filtered through a CRM entry, filtered again through however much time and motivation the rep had left at the end of a long drive.
Sales leaders asked what's actually holding back performance give an answer that isn't what most outsiders would guess. It isn't lead quality. It isn't pricing pressure or competitive intensity. SPOTIO's State of Field Sales survey found that "lack of visibility into field activity" ranks as a top-two internal challenge for both B2B and B2C sales leaders. Leaders are managing outcomes, quota attainment, closed revenue, that by the time they show up on a report, were decided weeks earlier by activity nobody was watching in real time.
Leading and Lagging Indicators for Field Sales Managers
The distinction is old, but field sales gives it new teeth. Leading indicators are activity metrics that predict where results are headed; lagging indicators are outcome metrics that confirm where results already landed. A manager who wants to coach a rep out of a slump needs leading data. A manager who's only evaluating past performance can get by on lagging data alone, but evaluation after the fact doesn't fix anything.
Inside sales teams generate leading-indicator data almost as a byproduct of doing the job: calls dial automatically, emails log themselves, demos land on a calendar with a timestamp attached. Field sales generates none of that on its own. What a manager sees is whatever a rep types into a CRM field once the visit is over, filtered through fatigue, memory, and how much the rep feels like documenting a conversation that didn't go anywhere.
Consider how little time is even available to generate that data. B2B field reps spend just 33% of their working hours actually in front of customers; B2C reps spend 44%. Everything outside that window, prep, drive time, admin, CRM entry, is time a manager has effectively zero visibility into. Not reduced visibility. None. And because the rep's own accounting of the day is the only record that exists, the manager is trusting a self-report generated by someone who has every incentive, conscious or not, to make a quiet day sound like a productive one.
That mechanism produces the trap described earlier. By the time a lagging metric, win rate, quota attainment, moves in the wrong direction, the problem it's reporting is already old news. It's a pipeline problem from two months back, dressed up as a quarterly number. Leading indicators give a manager a window to coach inside; lagging indicators only hand over a post-mortem once the deal is already gone.
The activity metrics with the strongest forward-looking signal in field sales
Visits per day is the foundational metric, and it has to be measured correctly to mean anything. Not calls, not attempted contacts logged from a desk, but completed face-to-face interactions, tracked daily rather than rolled up weekly. Daily tracking matters because a weekly average smooths over exactly the kind of dip a manager needs to catch early.
Benchmarks differ by motion. Door-to-door and canvassing teams see top performers aiming for 50 to 70 doors a day, depending on how dense the territory is. B2B territory reps, working longer sales cycles with fewer, higher-stakes calls, land closer to 8 to 12 visits a day. A rep whose attempts fall 25% week over week is signaling a territory problem, a motivation problem, or a routing problem; the direction of the change is the real diagnostic, not the absolute count.
What separates a good day from a wasted one is conversations with actual decision-makers, not visits alone. That's what contact rate is for: conversations with actual decision-makers divided by total attempts, times 100. SPOTIO's platform benchmarks put a healthy D2D contact rate in a defined range, and anything below 25% is a red flag for targeting, not effort. Two reps can walk away from the same day with identical visit counts on their sheet and have had completely different days in the field. One talked to homeowners and decision-makers; the other knocked on doors and left flyers. Contact rate is where that gap stops hiding.
From there, those conversations either turn into something or they do not. Visit-to-opportunity conversion rate answers it. Field visits are expensive once travel time and mileage are counted against a phone call, so conversion rate tells a manager whether that expense is buying pipeline or just burning a rep's day. A rep logging a high volume of visits at a low conversion rate needs a coaching conversation about qualification and targeting. A rep with fewer visits but a strong conversion rate needs a conversation about capacity, not technique. Those are two different problems wearing the same visit-count disguise, and conversion rate is what tells them apart. Conversion benchmarks also shift depending on the sales model itself, cold door knocks carry different baseline odds than warm referrals or scheduled appointments, so the number only means something in context.
Quote-to-close ratio catches the failure a stage later: closed deals divided by total quotes delivered. A proposal that goes out and never comes back signed points to one of a handful of specific causes, pricing, a weak proposal, competitive positioning, and each of those calls for a different fix. What makes this metric valuable is timing. The deal isn't closed-lost yet when this number moves. There's still a window to intervene.
Follow-up activity rate measures whether open pipeline is actually being worked: opportunities with follow-up activity divided by total open opportunities. A rep making a second or third visit without moving the deal forward is visible in this data long before it appears as a loss, since multi-visit deals are common in field sales. Absence of follow-up on open opportunities is one of the cleanest early warnings a field manager has access to.
Selling time ratio ties all of it together: hours spent actually selling divided by total work hours. Without this number, a high visit count can be badly misleading. A rep logging plenty of visits against a low selling time ratio doesn't have a motivation problem; the rep has a routing problem, or an admin problem eating the day.
Which brings the section to its sharpest finding. SPOTIO's 2026 data found that B2B teams below quota attainment logged more visits per week, on average, than teams hitting their numbers. Struggling reps weren't idle. They were busy, just busy doing the wrong things, and without contact rate, conversion rate, and selling time ratio sitting alongside raw visit counts, their managers had no way of seeing it.
The wall visit counts hit and the rise of conversation quality
Activity metrics have a ceiling. They can tell a manager who is working and roughly how hard. They cannot tell a manager what was actually said in the room, how an objection got handled, or why a proposal went out strong and came back unsigned. A high quota miss rate persists even at organizations with disciplined activity tracking, and that persistence is the proof: volume is necessary, but it was never sufficient on its own.
What conversation data reveals sits entirely outside what a visit log can capture. Whether a rep is genuinely running a qualification framework or just rubber-stamping every conversation into an opportunity. Where in the conversation a deal actually stalls, at the objection, at the price, at the mention of a competitor, or in the closing language itself. Certain talk tracks and follow-up phrases appear repeatedly in deals that close, while others appear repeatedly in deals that stall out. None of that lives in a CRM field that says "visit completed."
Inside sales solved this problem years ago with call recording and conversation intelligence. Field sales never had the equivalent, because the conversation that mattered happened in a living room or a parking lot, and once the rep walked out, it was gone. Whatever insight existed lived in the rep's memory and nowhere else.
Meeting-to-opportunity conversion offers a useful benchmark for where the real problem sits. Somewhere between 25% and 40% of meetings converting to qualified opportunities is the healthy range. Above that range, reps are likely rubber-stamping conversations that were never really qualified. Fall much lower, and discovery itself is weak. Telling which failure mode is in play requires listening to what actually happened in the meeting.
AI Conversation Analysis in a Field Sales Measurement System
This layer closes the gap the previous section describes, and it isn't a marginal add-on. The AI in sales market is projected to grow rapidly through 2032, which says something about where the industry has already decided the next competitive edge sits: not in more dashboards, but in understanding what's said inside the conversations those dashboards are trying to summarize.
Mechanically, the technology transcribes field conversations and tags them against a defined sales methodology, MEDDPICC, Sandler, Command of the Message, or a custom playbook built internally. That tagging turns a vague sense of "how did the call go" into a structured, comparable record across every rep on a team, something manual call review could never scale to.
The administrative payoff matters just as much as the analysis itself. Auto-generated CRM updates, follow-up email drafts, and meeting scheduling remove the manual data entry that currently eats a meaningful share of a rep's week. One 2026 analysis found manager time spent on call review dropped dramatically once this kind of automation took over the mechanical parts of the job, and the time that frees up doesn't disappear. It goes back into actual coaching, the kind that happens while a deal is still winnable.
The category has real depth by 2026. Gong, Chorus, Mindtickle, Salesify.ai, Hyperbound, and Cirrus Insight each bring something distinct, deep call analysis, real-time coaching, CRM-driven automation, and Gong and Chorus in particular are built for large teams running conversation analysis across high call volume. What's changed more recently, and what matters specifically for field teams, is the emergence of AI-assisted platforms built for in-person, mobile-first work: GPS-verified visit logging, conversation capture through a phone rather than a desktop, live coaching delivered to a rep standing in a driveway rather than sitting at a desk reviewing a call from the day before. That's the gap desktop-first conversation intelligence tools were never built to close.
The performance data backs the shift. That correlation doesn't prove the tool alone does the work. But it does say something about which teams are finding the visibility they need and which ones are still guessing. High-performing sales teams are 4.9× more likely to use AI in their sales processes, and sales professionals using AI report exceeding quota at notably higher rates, according to Salesforce's State of Sales Report and HubSpot data cited via ASPR.ai.
Pipeline velocity: tying activity, conversation, and territory data into one predictive number
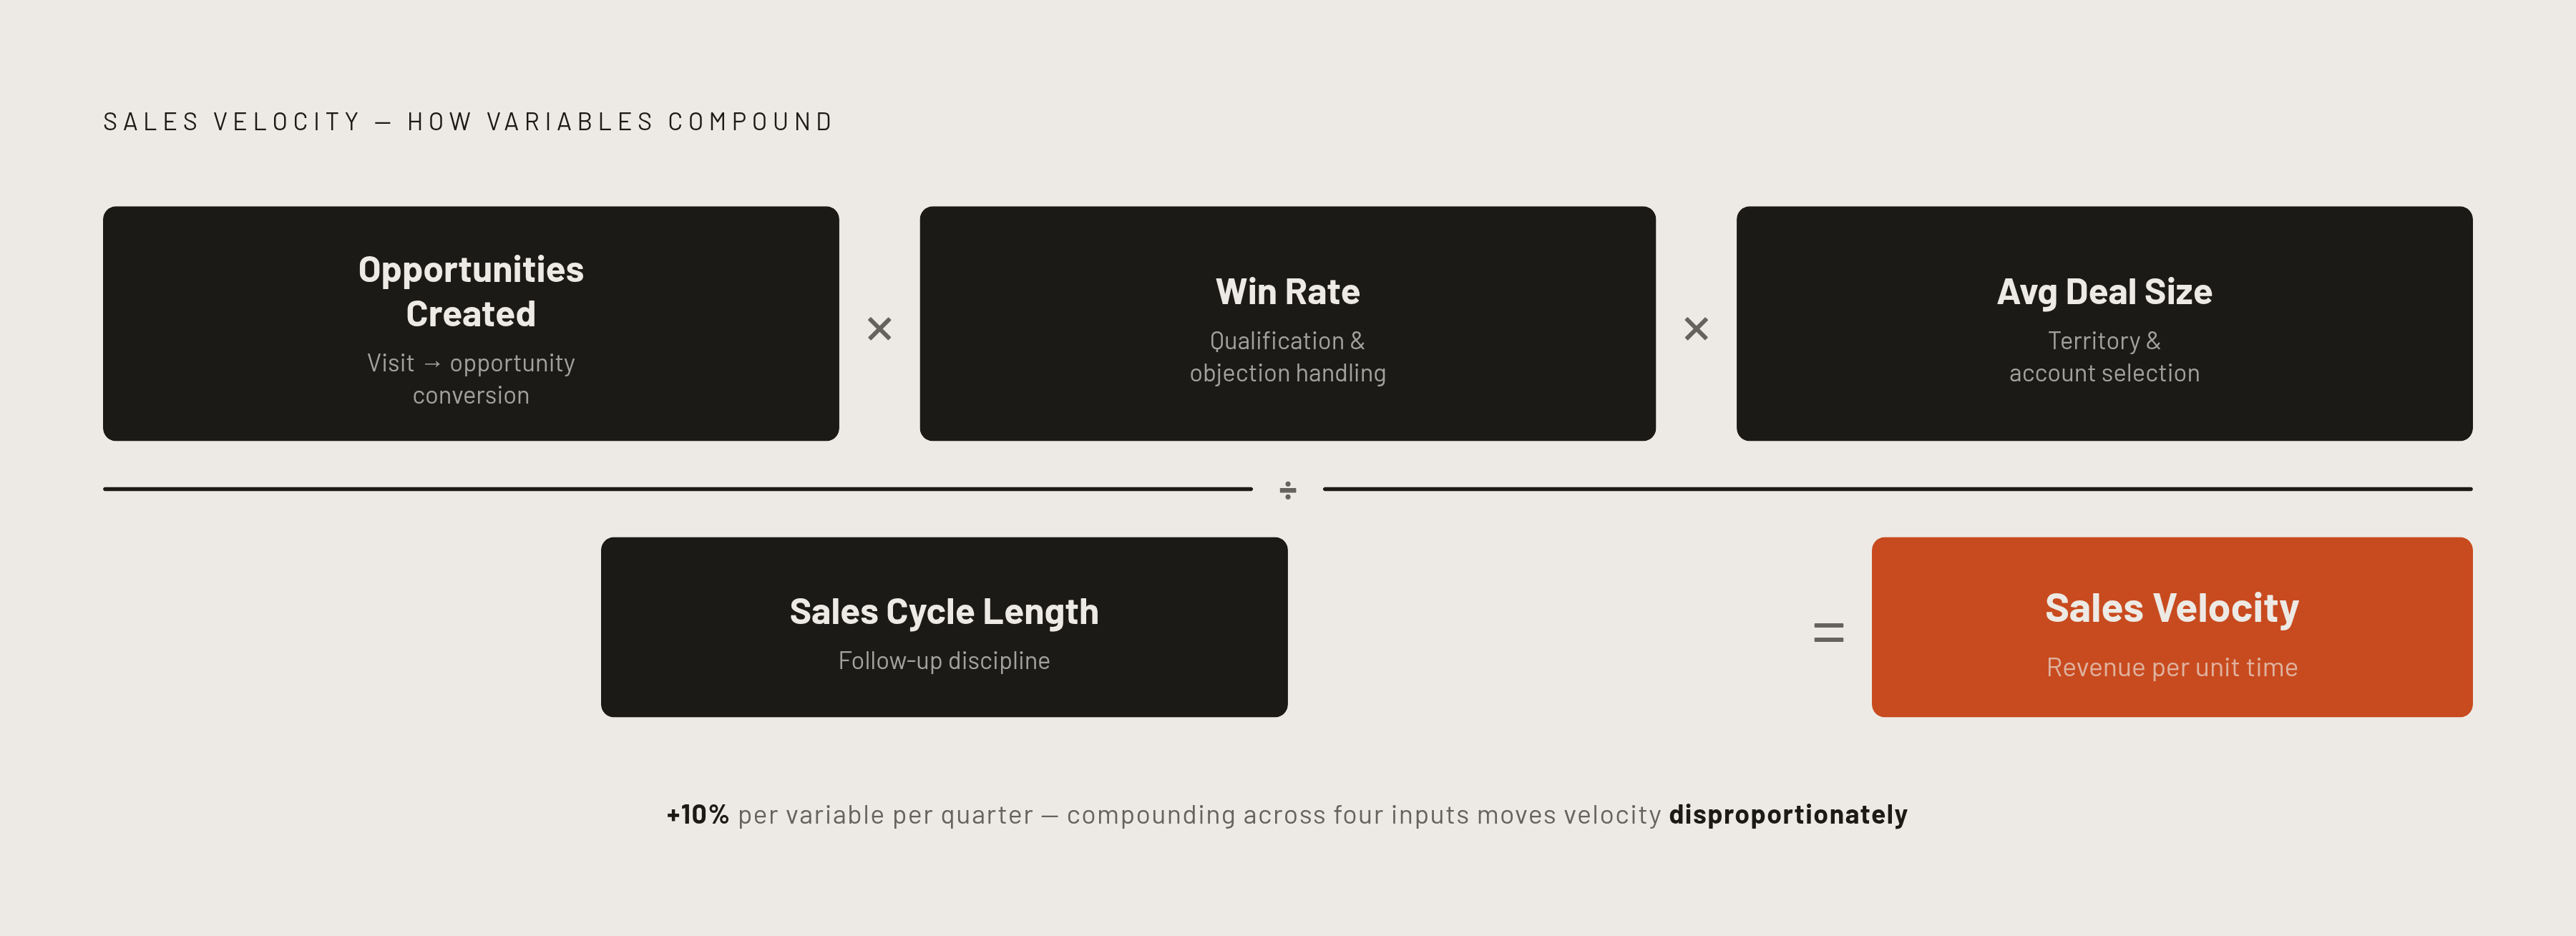
Sales velocity is the single number worth watching above everything else in this piece, calculated as opportunities created, multiplied by average deal size, multiplied by win rate, divided by sales cycle length.
Opportunities created reflects the activity layer, visit-to-opportunity conversion doing its work in the background. Win rate reflects the conversation layer, qualification discipline, objection handling, whether the proposal actually matched what the buyer needed to hear. Deal size reflects territory mix and account selection, which accounts a rep is spending time on and which they're leaving alone. Sales cycle length reflects follow-up discipline, whether a rep is advancing deals or letting them sit untouched between visits. Moving any one of those variables moves the compound number with it; a reasonable target is a 10% improvement quarter over quarter, and because the formula compounds, a small gain in any single variable produces an outsized effect on the whole.
Pipeline coverage ratio works as a companion check on the same idea, comparing total pipeline value to quota. Average deal velocity, days from first visit to close, does similar work as an early warning: slowing velocity is often the very first sign that a rep or a territory is heading for trouble, showing up weeks before the slowdown appears anywhere in revenue.
None of this holds up if it only gets measured at the team level, though. A solid company-wide win rate can hide one territory performing well above average and another quietly failing, and that gap is invisible unless the data gets broken out territory by territory rather than rolled into a single company number. Velocity, coverage, and deal cycle length all need that same disaggregation to mean anything operationally. SPOTIO cites a common benchmark for pipeline coverage ratio as a companion metric of 3x–4x coverage relative to quota, with anything below that range signaling risk before it hits the revenue line.
The manager visibility problem that makes all of this harder than it should be
None of the metrics above matter if the underlying systems can't actually produce them, and that's the uncomfortable part. More than half of field sales teams lack territory mapping or route optimization tools, with some still running field operations off spreadsheets. That's a significant gap. It means a large share of the industry is trying to calculate visit-to-opportunity conversion, contact rate, and selling time ratio using data that was never captured consistently to begin with.
Tool sprawl compounds the problem rather than solving it. The largest group of field teams runs multiple systems across their sales process, and a notable share are juggling five or more, and those systems generally weren't built to talk to each other. A rep's visit log lives in one platform, the CRM lives in another, conversation notes, if they exist at all, live somewhere else entirely. Stitching those into one coherent view of a rep's week takes manual effort that most managers don't have time for, which defeats the purpose of collecting the data.
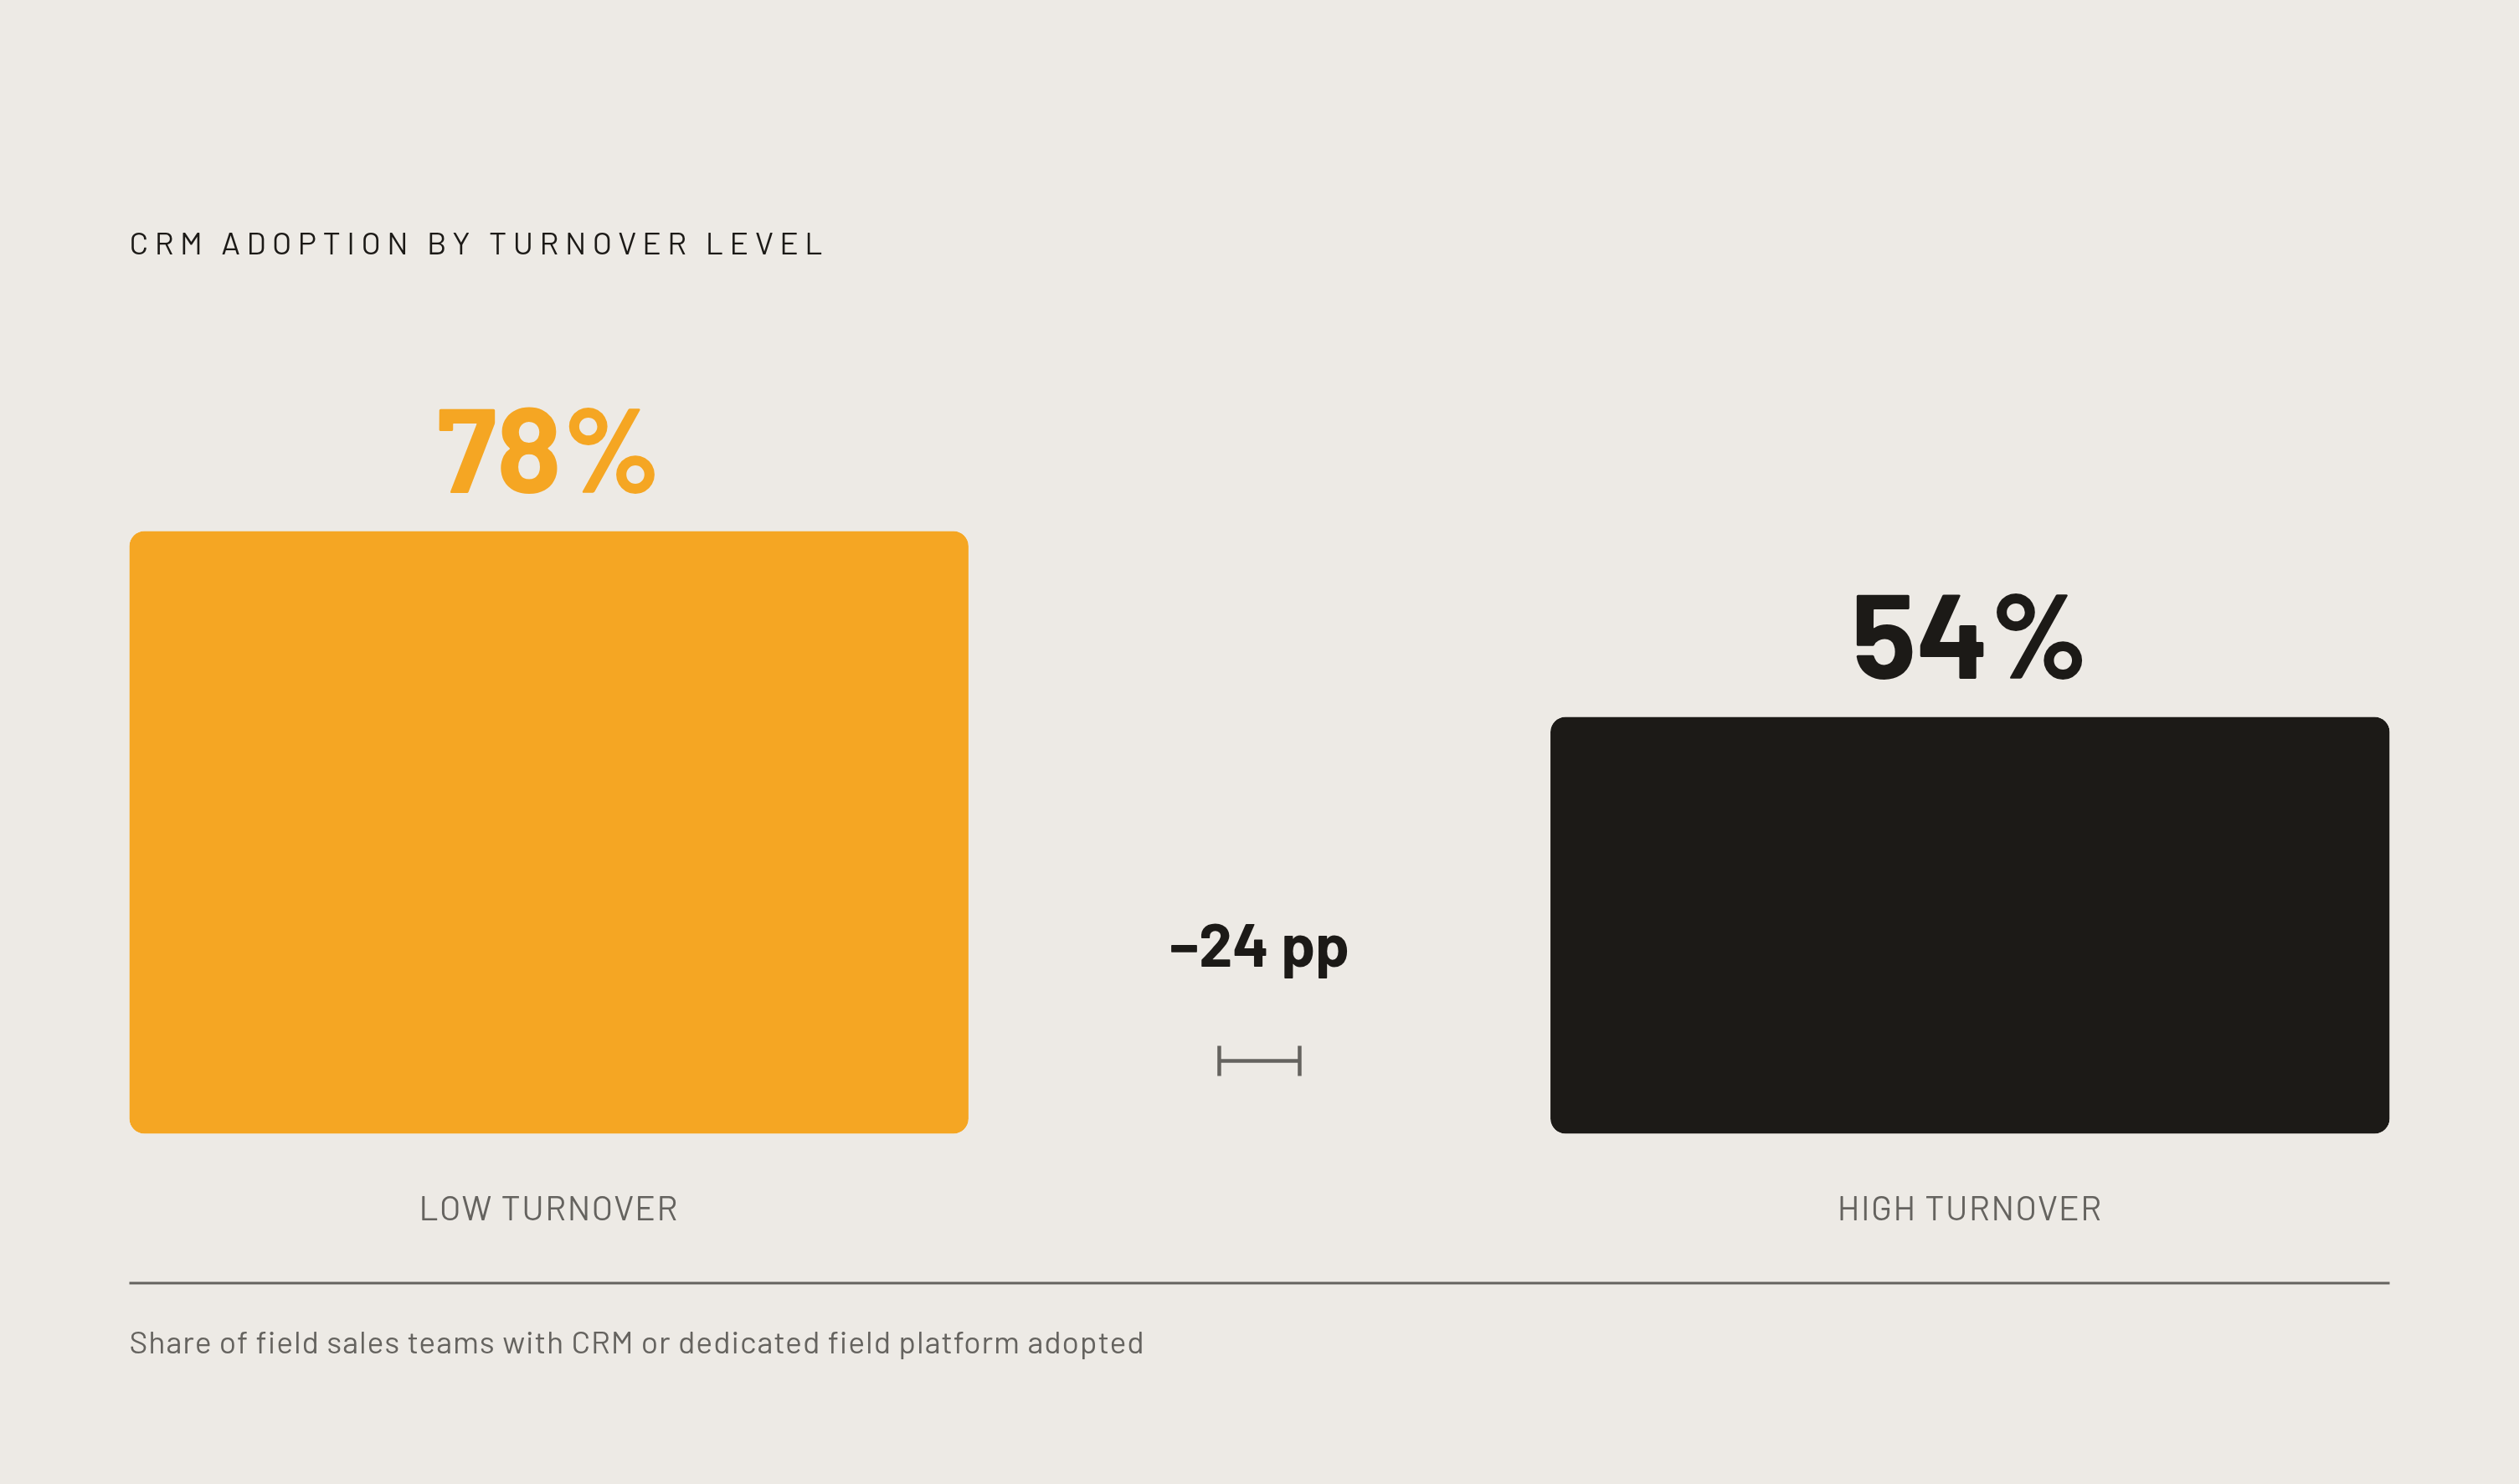
The clearest evidence that this isn't a cosmetic issue is visible in turnover. Among field teams with low turnover, 78% have adopted a CRM or dedicated field platform, compared with 54% among teams with high turnover, and that gap holds up across every performance metric measured. Teams that give reps and managers a real system to work from keep people longer and perform better, and teams running on spreadsheets and disconnected tools lose both people and visibility at the same time.
The metrics exist, the formulas are known, and the technology to capture conversation quality in the field, not just at a desk, is maturing fast, yet a majority of field sales organizations still lack the basic infrastructure to use any of it. The metrics exist. The formulas are known. The technology to capture conversation quality in the field, not just at a desk, is maturing fast. What's still missing, for a majority of field sales organizations, is the basic infrastructure to make any of it usable. The CRM adoption and performance gap exists. Companies using CRM.